Passwords, passwords, passwords: end users and defenders hate them, attackers love them. Despite the recent focus on stronger authentication forms by defenders, passwords are still the predominant way to get access to systems. And due to the habit of end users reusing passwords, and the multitude of public leaks in the last few years, they serve as an important attack vector in the red teamer’s arsenal. Find accounts of target X in the many publicly available dumps, try these passwords or logical iterations of it (Summer2014! might very well be Winter2018! at a later moment) on a webmail or other externally accessible portals, and you may have got initial access to your target’s systems. Can’t find any accounts of your target in the dump? No worries, your intel and recon may give you private email addresses that very well may be sharing the password with the target’s counter parts.
Major public password dumps
Recently, two major password dumps got leaked publicly: Exploit.in and Leakbase (goes also by the name BreachCompilation). This resulted in many millions of username-password combinations to be leaked. The leaks come in the form of multiple text files, neatly indexed in alphabetical order for ‘quick’ lookup. But the lookup remains extremely slow, especially if the index is done on the username instead of the domain name part of the email address. So, I wanted to re-index them, store them in a way that allows for quick lookup, and have the lookup interface easily accessible. I went with ELK as it ticks all the boxes. I’ll explain in this blog how you can do the same. All code can be found on our GitHub.
A few downsides of this approach
Before continuing I want to address a few short comings of this approach:
- Old data: one can argue that many of the accounts in the dumps are many years old and therefore not directly useful. Why go through all the trouble? Well, I rather have the knowledge of old passwords and then decide if I want to use them, then not knowing them at all.
- Parsing errors: the input files of the dump are not nicely formatted. They contain lots of errors in the form of different encodings, control characters, inconsistent structure, etc. I want to ‘sanitize’ the input to a certain degree to filter out the most commonly used errors in the dumps. But, that introduces the risk that I filter out too much. It’s about finding a balance. But overall, I’m ok with losing some input data.
- ELK performance: Elasticsearch may not be the best solution for this. A regular SQL DB may actually be better suited to store the data as we generally know how the data is formatted, and could also be faster with lookups. I went with ELK for this project as I wanted some more mileage under my belt with the ELK stack. Also, the performance still is good enough for me.
Overall process flow
Our goal is to search for passwords in our new Kibana web interface. To get there we need to do the following:
- Download the public password dumps, or find another way to have the input files on your computer.
- Create a new system/virtual machine that will serve as the ELK host.
- Setup and configure ELK.
- Create scripts to sanitize the input files and import the data.
- Do some post import tuning of Elasticsearch and Kibana.
Let’s walk through each step in more detail.
Getting the password dumps
Pointing you to the downloads is not going to work as the links quickly become obsolete, while new links appear. Search and you will find. As said earlier, both dumps from Exploit.in and Leakbase became public recently. But you may also be interested in dumps from ‘Anti Public’, LinkedIn (if you do the cracking yourself) and smaller leaks lesser broadly discussed in the news. Do note that there is overlap in the data from different dumps: not all dumps have unique data.
Whatever you download, you want to end up with (a collection of) files that have their data stored as username:password. Most of the dumps have it that way by default.
Creating the new system
More is better when talking about hardware. Both in CPU, memory and disk. I went with a virtual machine with 8 cores, 24GB ram and about 1TB of disk. The cores and memory are really important during the importing of the data. The disk space required depends on the size of the dumps you want to store. To give you an idea: storing Leakbase using my scripts requires about 308GB for Elasticsearch, Exploit.In about 160GB.
Operating system wise I went with a rather default Linux server. Small note of convenience here: setup the disk using LVM so you can easily increase the disk If you require more space later on.
Setup and configure ELK
There are many manuals for installation of ELK. I can recommend @Cyb3rWard0g’s HELK project on GitHub. It’s a great way to have the basics up and running in a matter of minutes.
git clone https://github.com/Cyb3rWard0g/HELK.git
./HELK/scripts/helk_install.sh
There are a few things we want to tune that will greatly improve the performance:
- Disable swap as that can really kill Elasticsearch’s performance:
sudo swapoff –a
remove swap mounts in /etc/fstab
- Increase the JVM’s memory usage to about 50% of available system memory:
Check the jvm options file at /etc/elasticsearch/jvm.options and /etc/logstash/jvm.options, and change the values of –Xms and –Xmx to half of your system memory. In my case for Elasticsearch:-Xmx12g -Xms12g
Do note that Elasticsearch and Logstash JVMs work independently and therefor their values together should not surpass your system memory.
We also need to instruct Logstash about how to interpret the data. I’m using the following configuration file:
root@office-elk:~# cat /etc/logstash/conf.d/passworddump2elk.conf
input {
    tcp {
        port   => 3515
        codec  => line
    }
}

filter{
   dissect {
     mapping => { "message" => "%{DumpName} %{Email} %{Password} %{Domain}" }
   }
   mutate{
      remove_field => [ "host", "port" ]
   }
}

output {
    if " _dissectfailure" in [tags] {
       file {
          path => "/var/log/logstash/logstash-import-failure-%{+YYYY-MM-dd}.log"
          codec => rubydebug
       }
   } else {
      elasticsearch{
         hosts => [ "127.0.0.1:9200" ]
         index => "passworddump-%{+YYYY.MM.dd}"
      }
   }
}
As you can see in the dissect filter we expect the data to appear in the following format:
DumpName EmailAddress Password Domain
There is a very good reason why we also want the Domain part of the email address as a separate indexable field: as red teamers you tend to search for accounts tied to specific domains/companies. Searching for <anything>@domainname is an extremely CPU expensive search to do. So, we spend some more CPU power on the importing to have quicker lookups in the end. We also store the DumpName as this might become handy in some cases. And for troubleshooting we store all lines that didn’t parse correctly using the “if ” _dissectfailure” in [tags]”.
Note: using a dissect vs a grok filter gives us a small performance increase. But if you want you can accomplish the same using grok.
Don’t forget to restart the services for the config to become active.
Sanitize and import the data
The raw data that we get form the dumps is generally speaking organized. But it does contain errors, e.g. parts of html code as password, weird long lines, multitudes of spaces, passwords in languages that we are not interested in, non printable control characters.
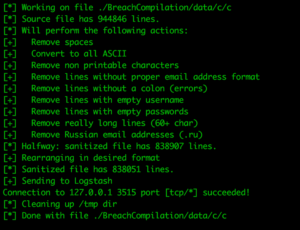
I’ve chosen to do the following cleaning actions in my script. It’s done with simple cut, grep, awk commands, so you can easily tune to your preference:
- Remove spaces from the entire line
This has the risk that you lose passwords that have a space in it. In my testing I’ve concluded that the far majority of spaces in the input files are from initial parsing or saving errors, and only a tiny fraction could perhaps be a (smart) user that had a space in the password. - Convert to all ASCII
You may find the most interesting character set usage in the dumps. I’m solely interested in full ASCII. This is a rather bold way to sanitize that works for me. You may want to do differently. - Remove non-printable characters
Again you may find the most interesting characters in the dumps. During my testing I kept encountering control characters that I never even heard about. So I decided to remove all non-printable all together. But whatever you decide to change, you really want to get rid of all the control characters. - Remove lines without proper email address format
This turns out to be a rather efficient way of cleaning. Do note that this means that the occasional [email protected] will also be purged. - Remove lines without a colon, empty username or empty password
In my testing this turned out to be rather effective. - Remove really long lines (60+ char)
You will purge the occasional extremely long email addresses or passwords, but in my testing this appeared to be near 0. Especially for corporate email addresses where most of the times a strict naming policy is in place. - Remove Russian email addresses (.ru)
The amount of .ru email addresses in the dumps, and the rather unlikely case that it may be interesting, made me purged them all together. This saves import time, lookup time and a considerable amount of disk space.
After the purging of irrelevant data, we still need to reformat the data in a way that Logstash can understand. I use a AWK one liner for this, that’s explained in the comments of the script. Finally, we send it to the Logstash daemon who will do the formatting and sending along to Elasticsearch.
It’s important to note that even though we rather heavily scrutinized the input data earlier on, the AWK reformatting and the Logstash importing still can filter out lines that contain errors.
Overall, we lose some data that might actually be used when sanitizing differently. When using my scripts on the Leakbase dump, you end up with 1.1 billion records in Elasticsearch while the import data roughly contains 1.4 billion records. For the Exploit.In dump its about 600 out of 800 million. It’s about finding a balance that works for you. I’m looking forward to your pull requests for better cleaning of the import data.
To kick off the whole importing you can run a command like:
for i in $(find ./BreachCompilation/data/*.txt -type f); do ./sanitizePasswordDump.sh $i LeakBase; done
The 2nd parameter (LeakBase) is the name I give to this dump.
Don’t be surprised if this command takes the better part of a day to complete, so run it in a screen session.
Post import tuning
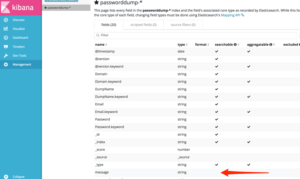
Now that we are importing data to Elasticsearch, there is a small performance tuning that we can do: remove the indexing of the ‘message’ field. The message field contains the entire message that was received via Logstash. An index requires CPU power and uses (some) disk space. As we already index the sub-fields this is rather useless. You can also choose to not store it at all. But the general advice is to keep it around. You may never know when it becomes useful. With the following command we keep it, but we remove the indexation.
curl -XPUT http://localhost:9200/_template/passworddump_template -d '
{
 "template" : "passworddump-*",
 "mappings" : {
  "logs": {
   "properties" : {
    "message" : {
    "type":"text", "store":"yes", "index":"false", "fields":{"keyword":{"type":"keyword","ignore_above":256}}
    }
   }
  }
 }
}'
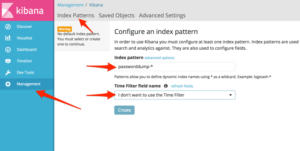
Now the only thing left to do is to instruct Elasticsearch to create the actual index patterns. We do this via the Kibana web interface:
- click ‘Management’ and fill in the Index pattern: in our case passworddump-*.
- Select the option ‘I don’t want to use the Time Filter’ as we don’t have any use for searching on specific time periods of the import.
Important note: if you create the index before you have altered the indexation options (previous step), your indexation preferences are not stored; its only set on index creation time. You can verify this by checking if the ‘message’ field is searchable; it should not. If it is, remove this index, store the template again and recreate the index.
There are a few more things that can make your life easier when querying:
- Change advanced setting discover:sampleSize to a higher value to have more results presented.
- Create a view with all the relevant data in 1 shot:
By default Kibana shows the raw message to the screen. This is isn’t very helpful. Go to ‘Discover’, expand one of the results and hit the ‘Toggle column in table’ button next to the fields you want to be displayed, e.g. DumpName, Email, Password and Domain).
- Make this viewing a repeatable view
Now hit ‘Save’ in the top bar, give it a name, and hit save. This search is now saved and you can always go back to this easy viewing.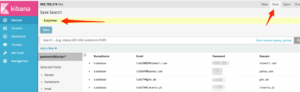
- Large data search script
For the domains that have more than a few hits, or for the cases where you want to redirect it to a file for easy importing to another tool, Kibana is not the easiest interface. I’ve created a little script that can help you. It requires 1 parameter: the exact Domain search string you would give to Elasticsearch when querying it directly. It returns a list of username:password for your query.
Good luck searching!