In this blog post we are going to explore the power of well-known process monitoring utilities and demonstrate how the technology behind these tools can be used by Red Teams within offensive operations.
Having a good technical understanding of the systems we land on during an engagement is a key condition for deciding what is going to be the next step within an operation. Collecting and analysing data of running processes from compromised systems gives us a wealth of information and helps us to better understand how the IT landscape from a target organisation is setup. Moreover, periodically polling process data allows us to react on changes within the environment or provide triggers when an investigation is taking place.
To be able to collect detailed process data from compromised end-points we wrote a collection of process tools which brings the power of these advanced process utilities to C2 frameworks (such as Cobalt Strike).
The tools (including source) can be found here:
https://github.com/outflanknl/Ps-Tools
Windows internals system utilities
We will first explore which utilities are available for harvesting process information from a Windows computer. We can then learn how these utilities collect such information, so that we can subsequently leverage these techniques in our red teaming tools.
The Windows Operating System is equipped with many out-of-the-box utilities to administer the system. Although most of these tools would fit the purpose of basic system administration, some lack the functionality we need for more advanced troubleshooting and monitoring. The Windows task manager for example, provides us basic information about all the processes running within the system, but what if we need more detailed information like the object handles, network connections or loaded modules within a particular process?
To collect detailed information, there is more advanced tooling available. For example the system utilities within the Sysinternals suite. As a Red Team operator with a long background in network and system administration I have always been a big fan of the Sysinternals tools.
When troubleshooting a slow performing server system or a possibly infected client computer, most times I started initial troubleshooting with tools like Process Explorer or Procmon.
From a digital forensics perspective these tools are also very useful for basic dynamic analysis of malware samples and searching for artefacts on infected systems. So why are these tools so popular among system administrators as well as security professionals? Let’s explore this by showing some interesting process information we can gather using the Process Explorer tool.
Using Process Explorer
First thing we notice when we start Process Explorer is the list/tree of all the processes currently active on the system. This provides us information about process names, process IDs, the user context and integrity level of the process and version information. More information can be made visible in this view by customizing the columns.

If we enable the lower pane, we can show all modules loaded within a specific process or switch to the handle view to show all the named handle objects being used by a process:
Viewing modules can be useful to identify malicious libraries being loaded within a process or – from a Red team perspective – if there’s a security product active (e.g. EDR) that injected a user mode API hooking module.
Switching to the handle view allows you to view the type and name of all named objects being used within the process. This might be useful to view which file objects and registry keys are opened or named pipes being used for inter-process communication.
If we double click a process name, a window with more detailed information will popup. Let’s explore some tabs to view additional properties from a process:
The image tab shows us information about the binary path, working directory and command line parameters. Furthermore, it shows information about the user context, parent process, image type (x86 vs x64) and more.

The thread tab provides information about running threads within the process. Selecting a thread and then clicking the stack button will display the call stack for this specific thread. To view the threads/calls running in kernel-mode, Process Explorer uses a kernel driver which is installed when running in elevated mode.
From a DFIR perspective, thread information is useful to detect memory injection techniques a.k.a. fileless malware. Threads not backed by a file on disk for example might indicate that something fishy is going on. To have more insights into threads and memory I strongly advise to also look at the Process Hacker tool.
Another interesting tab in Process Explorer is the TCP/IP tab. This will show all the network connection related to the process. From an offensive perspective this can be useful to detect when connections are made from a system under our control. An incoming PowerShell remoting session or RDP session might indicate that an investigation is started.
Leveraging these techniques offensively
Now we have looked at some interesting process information we can gather using Process Explorer, you might wonder how we can get access to the same information available from user-mode within our favourite C2 frameworks. Of course, we could use PowerShell as this provides us a very powerful scripting language and enables access to the Windows APIs. But with PowerShell under heavy security monitoring these days, we try to avoid this method.
Within Cobalt Strike we can use the ps command within the beacon context. This command displays basic process information from all processes running on the system. Combined with @r3dQu1nn ProcessColor aggressor script this is probably the best method to easily collect process information.
The output from the ps command is useful for a quick triage of running processes, but lacks the detailed information which can help us to better understand the system. To collect more detailed information, we wrote our own process info utilities to collect and enrich the information we can gather from the systems we compromise.
Outflank Ps-Tools
Trying to replicate the functionality and information provided by a tool like Process Explorer is not an easy task. First, we need to figure out how these tools work under the hood (and within user-mode), next we need to figure out the best way to display this information from a console instead of a GUI.
After analyzing publicly available code it became clear that many low-level system information tools are heavily based on the native NtQuerySystemInformation API. Although the API and related structures are not fully documented, this API allows you to collect a wealth of information about a Windows system. So, with NtQuerySystemInformation as a starting point to collect overall information about all processes running in the system, we then use the PEB of individual processes to collect more detailed info about each process. Using the NtQueryInformationProcess API we can read the PROCESS_BASIC_INFORMATION structure from a process using its process handle and locate the PebBaseAddress. From there we can use the NtReadVirtualMemory API to read the RTL_USER_PROCESS_PARAMETERS structure which allows us to read the ImagePathName and CommandLine parameters of a process.
With these API’s as the basic fundament of our code, we wrote the following process information tools:
- Psx: Shows a detailed list of all processes running on the system.
- Psk: Shows detailed kernel information including loaded driver modules.
- Psc: Shows a detailed list of all processes with Established TCP connections.
- Psm: Show detailed module information from a specific process id (loaded modules, network connections e.g.).
- Psh: Show detailed handle information from a specific process id (object handles, network connections e.g.).
- Psw: Show Window titles from processes with active Windows.
These tools are all written as reflective DLLs in C language and can be reflectively loaded within a spawned process using a C2 framework like Cobalt Strike (or any other framework which allows Reflective DLL injection). For Cobalt Strike we included an aggressor script which can be used to load the tools using the Cobalt Strike script manager.
Let’s explore each individual tool running within Cobalt Strike to demonstrate its functionality and which information can be gathered using the tool:
Psx
This tool displays a detailed list of all the processes running on the system. The output can be compared to the output from the main screen of Process Explorer. It shows us the name of the process, process ID, parent PID, create time and information related to the process binaries (architecture, company name, versions e.g.). As you can see it also displays interesting info from the active kernel running on the system, for example the kernel base address, which is information useful when doing kernel exploitation (calculating ROP gadget offsets e.g.). This information can all be gathered from a normal user (non-elevated) context.

If we have enough permissions to open a handle to the process, we can read more information like the user context and integrity level from its token. Enumerating the PEB and its related structures allows us to get information about the image path and command line parameters:
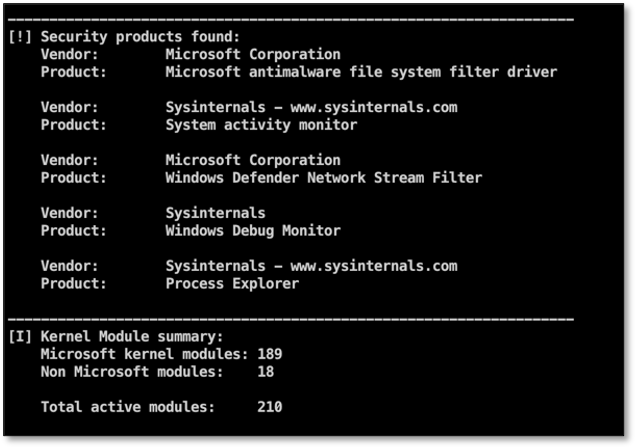
As you may have noticed, we’re reading and displaying version information from the process binary images, for example company name and description. Using the company name it is very easy to enumerate all active security products within the system. Using this tool, we’re comparing the company names of all active processes against a list of well-known security product vendors and display a summary of the results:
Psk
This tool displays detailed information about the running kernel including all the loaded driver modules. Just like the Psx tool, it also provides a summary of all the loaded kernel modules from well-known security products.
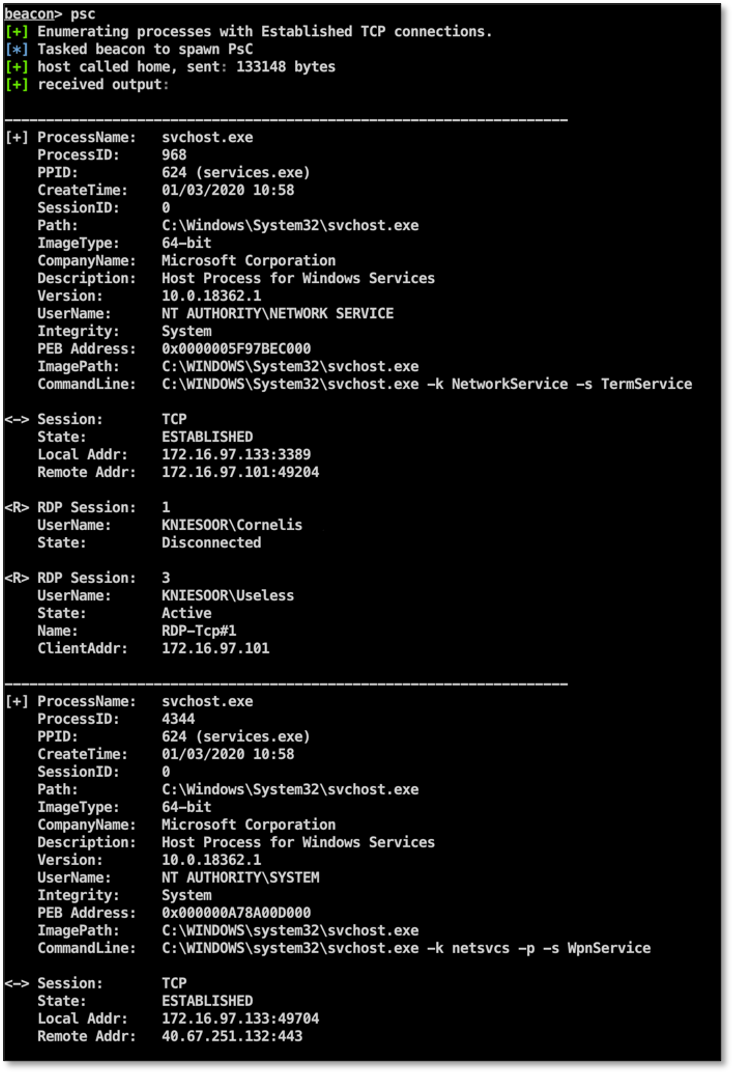
Psc
This tool uses the same techniques to enumerate active processes like Psx, except that it only displays processes with active network connections (IPv4, IPv6 TCP, RDP, ICA):
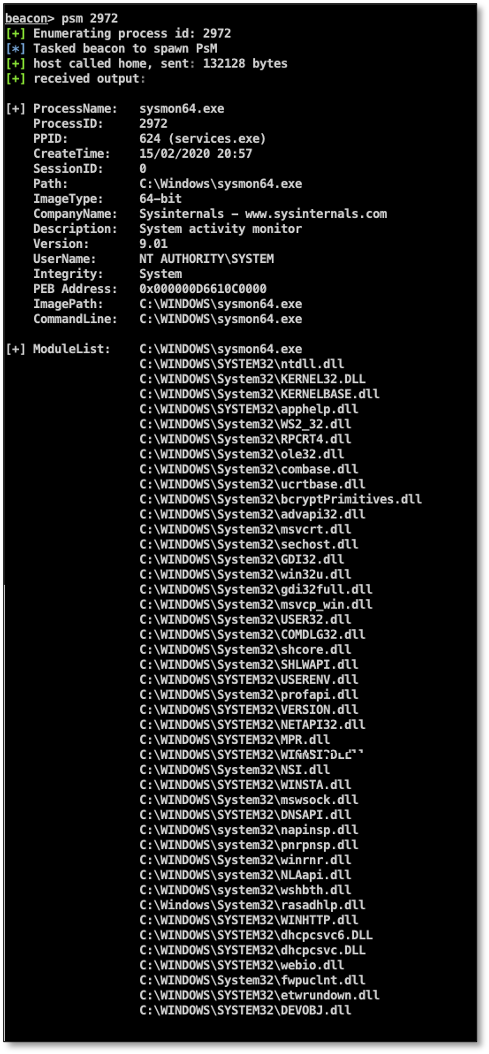
Psm
This tool can be used to list details about a specific process. It will display a list of all the modules (dll’s) in use by the process and network communication:
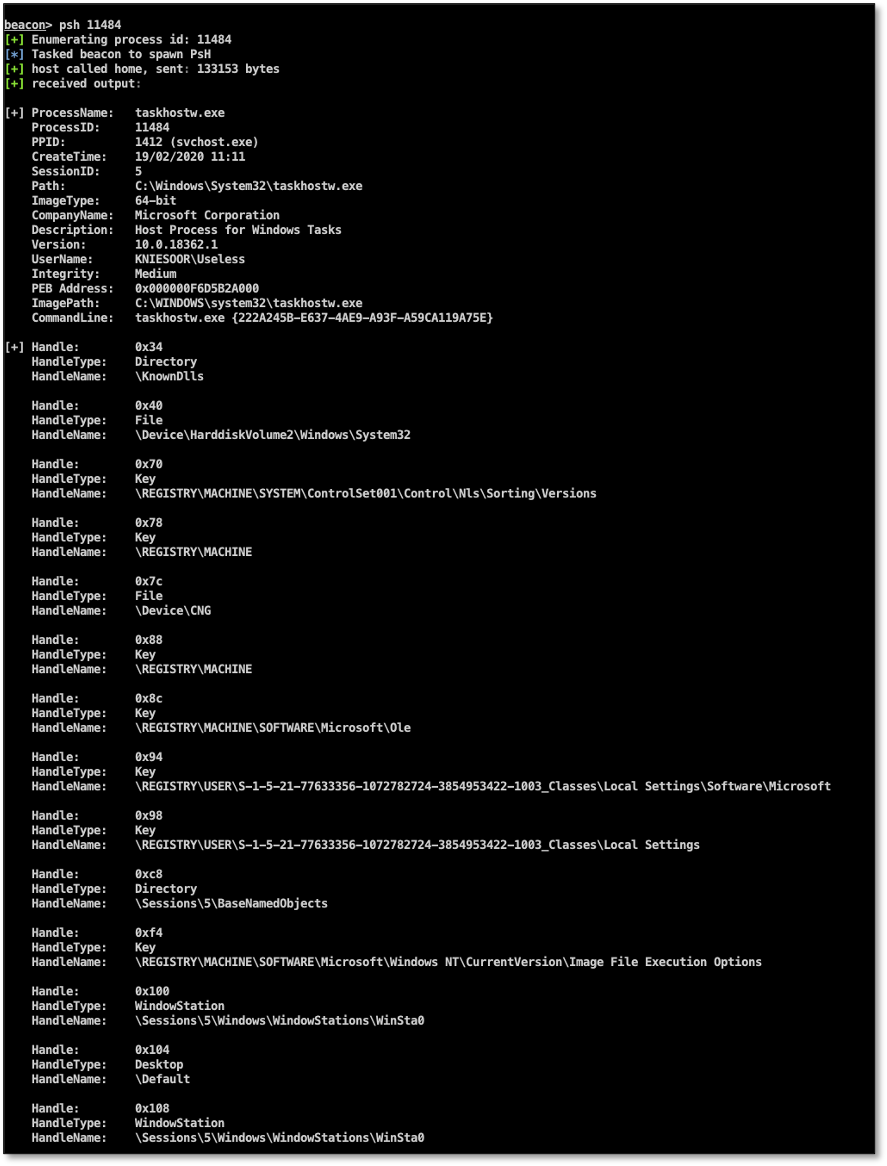
Psh
Same as Psm, but instead of loaded modules, shows a list of handles in use by the process:
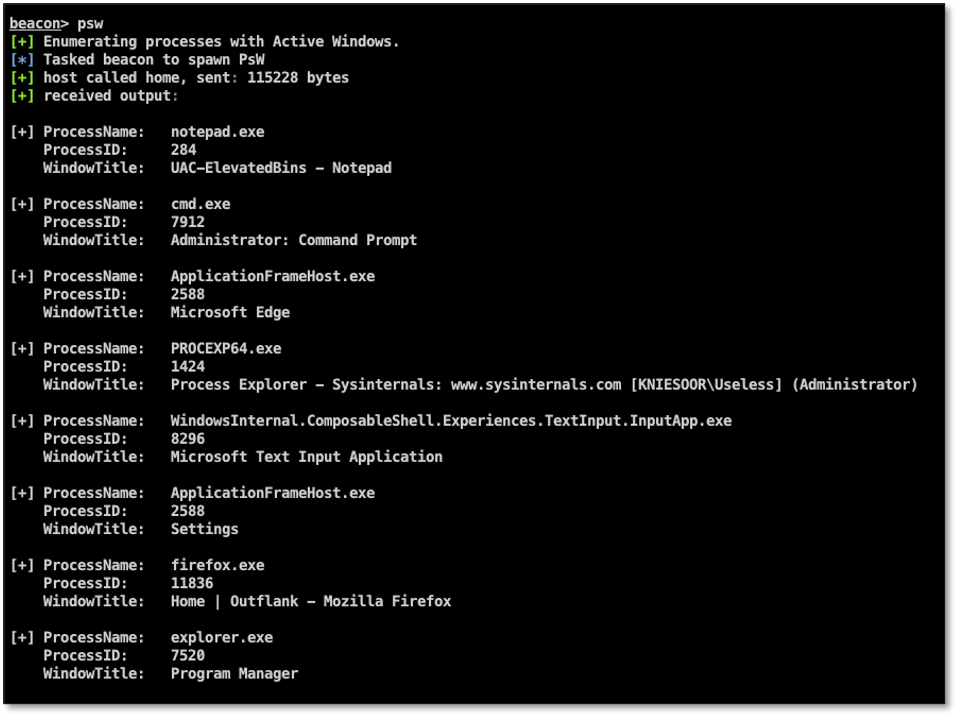
Psw
Last but not least the Psw tool. This tool will show a list of processes which have active window handles opened on the desktop of the user, including the window titles. This is useful to determine which GUI applications are opened by a user without having to create desktop screenshots:
Use cases
So how is this useful in offensive operations, you might wonder? After initial access to a compromised asset, we usually use this information for the following purposes:
- Detecting security tooling on a compromised asset. Not only by process information names, but also by loaded modules.
- Identifying user-land hooking engines through loaded modules.
- Finding opportunities for lateral movement (via network sessions) and privilege escalation.
After initial compromise, you can periodically poll detailed process information and start building triggers. For example, we feed this information automatically into our tool RedELK. We can then start building alerts on suspicious changes in process information such as:
- A security investigation tool has been started or a new end-point security product has been installed.
- Incoming network connections from the security department via RDP or PowerShell remoting.
- Another process has opened a handle on one of our malware artefacts (e.g. a file used for persistence).
Conclusion
In this blogpost we demonstrated how tools like Sysinternals Process Explorer can be used to get more detailed information about processes running on a system and how this information can help administrators and security professionals to troubleshoot and investigate a system for possible security or performance related issues.
The same information is also very relevant and useful for Red Teams having access to compromised systems during an assessment. It helps to better understand the systems and IT infrastructure from your target and periodically polling of this information allows a Red Team to react on possible changes within the IT environment (an investigation trigger, for example).
We replicated some of the functionality provided by tools like Process Explorer so we can benefit from the same information in offensive operations. For this we created several process monitoring tools, which can be used within a C2 framework like Cobalt Strike. We demonstrated how to use the tools and which information can be gathered by using the tools.
The tools are available from our GitHub page and are ready to be used within Cobalt Strike.