This is part 3 of a multipart blog series on RedELK: Outflank’s open sourced tooling that acts as a red team’s SIEM and helps with overall improved oversight during red team operations.
In part 1 of this blog series I discussed the core concepts of RedELK and why you should want a tool like this. In part 2 I described a walk-through on integrating RedELK into your red teaming infrastructure. Read those blogs to get a better background understanding of RedELK.
For this blog I’ve setup and compromised a fictitious company. I use the logs from that hack to walk through various options of RedELK. It should make clear why RedELK is really helpful in gaining operational oversight during the campaign.
Intro: the Stroop lab got hacked
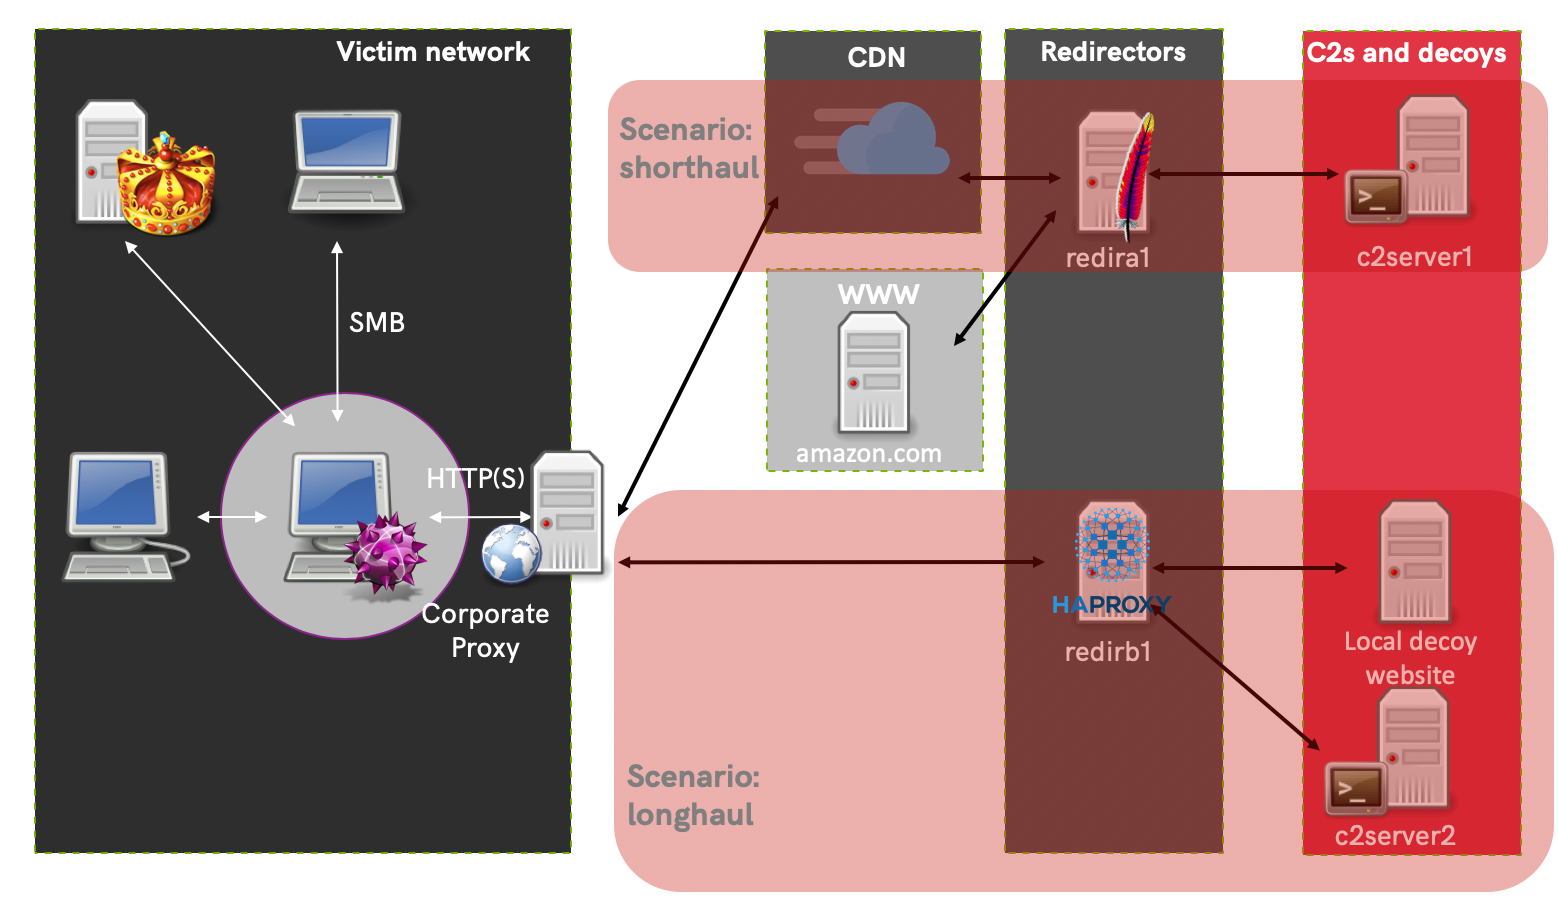
In this blog I continue with the offensive lab setup created in part 2. In summary this means that the offensive campaign contains two attack scenarios supported by their own offensive infrastructure, named shorthaul and longhaul. Each have their own technology for transport and each has a dedicated Cobalt Strike C2 server. The image below should give you an overview.
Now let’s discuss the target: Stroop B.V., a fictitious stroopwafel company. Although the competition is catching up, their stroopwafels are regarded as a real treat and enjoyed around the world. Stroop’s IT environment spans over a few thousand users and computers, an Active Directory domain with subdomains and locations (sites) around the world. With regards to security they are coming from a traditional ‘coconut’-approach: hard security on the outside (perimeter), but no real segmentation or filtering on the inside. They do have a few security measures, such as proxying all internet traffic, dedicated admin-accounts and admin-workstations for AD related tasks. Finally, in order to get to the industrial controls systems (ICS) that produce the stroopwafels – and guard the recipe – it is required to go via a dedicated jump host.
In this demo, I have gained Domain Admin privileges and DCsync’ed the krbtgt account. I have not accessed the secret recipes as I do not want to give away too much details for future students of our trainings. Yes, you read that right, this is the same lab setup we use in our trainings. And yes, besides an awesome lab our students also get to enjoy delicious stroopwafels during our trainings. No digital but real stroopwafels. 🙂
In preparation for this blog post I have hacked through the network already. To make it easy for you to play with the same data, I have uploaded every logfile of this demo (Cobalt Strike, HAProxy and Apache) to the RedELK github. You can use this demo data to import into your own RedELK server and to get hands-on experience with using RedELK.
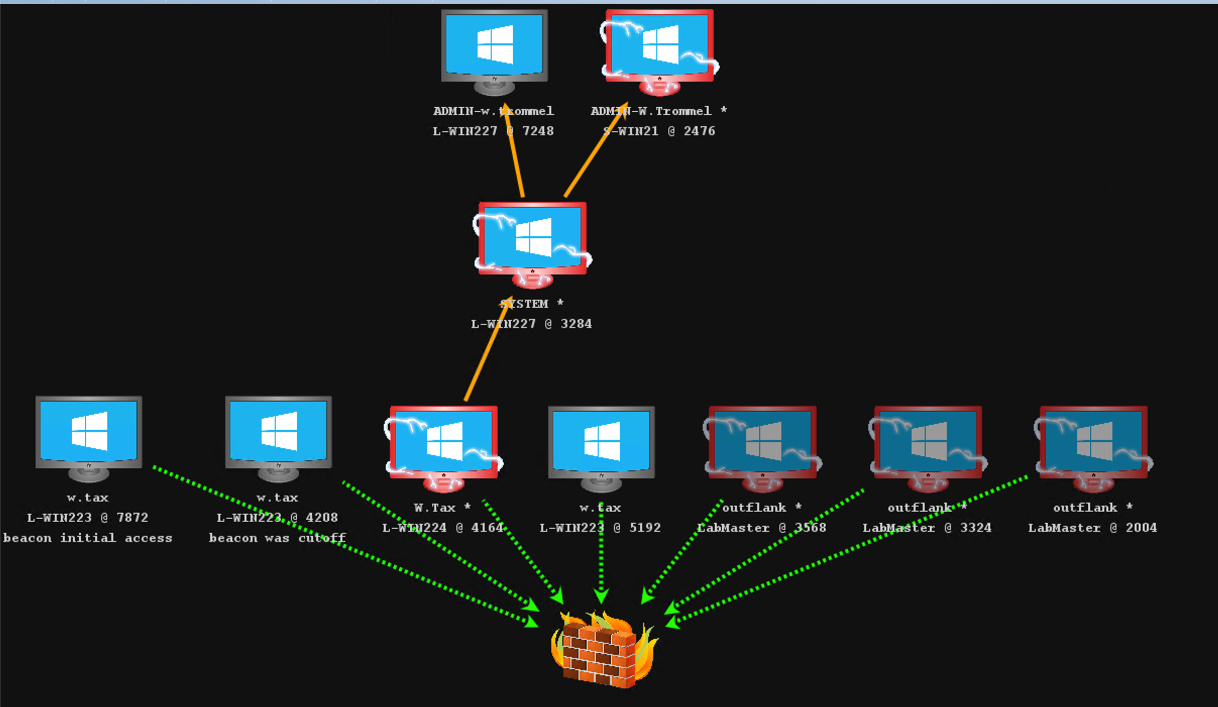
The end result of the running beacons can be seen below in the two overviews from our Cobalt Strike C2 servers.

Why RedELK?
The mere fact that I have to present to you two pictures from two different Cobalt Strike C2 servers is indicative why we started working on what later resulted in RedELK. Cobalt Strike (or any other C2 framework) is great for live hacking, but it is not great for a central overview. And you really want such a central overview for any bigger red teaming campaign. This is exactly what RedELK does: it gathers all the logs from C2 frameworks and from traffic redirectors, formats and enriches the data, presents it in a single location to give you oversight and allows for easy searching of the data. Finally, it has some logic to alarm you about suspected blue team analyses.
I’ll cover the alarming in a later blog. In this blog we focus on the central presentation and searching.
RedELK oversight
Let’s start with the oversight functionality of RedELK. We can easily see:
Red Team Operations: Every action from every operator on every C2 serverRedirector Traffic: All traffic that somewhere touched our infrastructure
Because we put everything in an Elasticsearch database, searching through the data is made easy. This way we can answer questions like ‘Did we touch system X on a specific day?’ or ‘What source IP has scanned our redirectors with a user agent similar to our implant but not on the correct URL?’
Besides free format searching, RedELK ships with several pre-made searches, visualisations and dashboards. These are:
CS Downloads: all downloaded files form every Cobalt Strike C2 server, directly accessible for download via your browser.CS Keystrokes: every keystroke logged from every Cobalt Strike C2 server.CS IOCs: every Indicator Of Compromise of your operation.CS Screenshots: every screenshot from every Cobalt Strike C2 server, with thumbnails and full images directly visible via your browser.CS Beacons: list with details of every Cobalt Strike beacon.Beacon dashboard: a dashboard with all relevant info from implants.Traffic dashboard: a dashboard with all relevant info on redirector traffic.
Note: at the moment of writing the stable version of RedELK is 1.0.2. In that version there is full support for Cobalt Strike, but no other C2 framework. However, future stable versions will support other C2 frameworks. The version currently in development already has support for PoshC2. Covenant is planned next. Also, the names of the pre-made views searches and of some fields are also made more generic to support other C2 frameworks.
We need to login before we can explore some of these views and show the power of search. See the example below where I log in, go to the Discover section in Kibana, change the time period and open one of the pre-made views (redirector traffic dashboard).
Note: every animated GIF in this blog is clickable to better see the details.

Red Team Operations
Let’s start with an overview of every action on every C2 server; select the Red Team Operations view. Every line represents a single log line of your C2 tool, in our case Cobalt Strike. Some events are omitted by default in this view: join-leave events, ‘new beacon’ events from the main Event Log and everything from the weblog. Feel free to modify it to your liking – you can even click ‘Save’ and overwrite one of RedELK’s pre-made views.
In the example below you can see the default layout contains the time, attackscenario, username, internal IP address, hostname, OS and the actual message from the C2 tool. In our case this is 640 events from multiple team servers from both attack scenarios!
Now let’s say the white team asked if, where and when we used PsExec. Easy question to answer! We search for psexec* and are presented with only the logs where psexec was mentioned. In our case only one time, where we jumped from system L-WIN224 to L-WIN227.
As you can see, RedELK does a few things for you. First of all, it indexes all the logs, parses relevant items, makes them searchable and presents them to you in an easy interface.
Cobalt Strike users will notice that there is something going on here. How can RedELK give you all the relevant metadata (username, hostname, etc) per log line while Cobalt Strike only presents that info in the very first metadata line of a new beacon? Well, RedELK has background running scripts that enrich *every* log line with the relevant data. As a result, every log line from a beacon log has the relevant info such as username, hostname, etc. Very nice!
Another simple but super useful thing we saw in the demo above is that every log line contains a clickable link to the full beacon.log. Full beacon logs directly visible in your browser! Great news for us non-Elasticsearch-heros: CTRL+F for easy searching.
As you can see, a few clicks in a web browser beat SSHing into all of your C2 servers and grepping through the logs (you shouldn’t give everybody in your red team SSH access to your C2 servers anyway, right?).
Now that was the basics. Let’s explore a few more pre-made RedELK views.
List of Indicators of Compromise
In the previous example I searched for PsExec lateral movement actions. As you probably know, PsExec uploads an executable that contains your evil code to the target system, creates a service pointing to this executable and remotely starts that service. This leaves several traces on the remote system, or Indicators of Compromise as the blue team likes to call them. Cobalt Strike does a very good job in keeping track of IOCs it generates. In RedELK I created a parser for such IOC events and pre-made a search for you. As a result you can get a full listing of every IOC of your campaign with a single click. Four clicks if you count the ‘export to CSV’ function of Kibana as well.
Cobalt Strike Downloads
This is one of the functions I am personally most happy with. During our red team operations we often download files from our target to get a better understanding of the business operations (e.g. a manual on payment operations). Most C2 frameworks, and Cobalt Strike in this example, download files form the implant to the C2 server. Before you can open the file you need to sync it to your local client. The reason for this is valid: you don’t want every file to auto sync to every logged in operator. But with dozens maybe hundreds of files per C2 server, and multiple C2 servers in the campaign, I often get lost and I no longer know on which C2 which file was downloaded. Especially if it was downloaded by one of my colleagues. Within the C2 framework interface it is very hard to search for the file you are looking for. Result: time lost due to useless syncing and viewing of files.
RedELK solves this by presenting an aggregated list of every file from every C2 in the campaign. In the Kibana interface you can see and search all kinds of details (attack scenario name, username, system name, file name, etc). In the background, RedELK has already synced every file to the local RedELK server, allowing for easy one click downloads straight from Kibana.
Logged keystrokes
Ever had difficulties trying to remember which user on what moment entered that one specific term that was logged in a keystroke? RedELK to the rescue: one click easy presenting of all logged keystrokes. And, of course searchable.
I believe there is more work to be done by formatting the keystroke logs and alarming when certain keywords are found. But that is left for future versions.
Screenshots
Another thing that was bugging me was trying to recall a specific screenshot weeks/months earlier in the campaign. Most often I can’t remember the user, but when I see the picture I know what I was looking for. With hundreds of screenshots per C2 server this becomes time consuming.
To solve this, RedELK indexes every screenshot taken, and makes them ready for download and presents some sort of a thumbnail preview picture. Hooray!
I’m not entirely happy just yet with the thumbnail previews, specifically the size. I’m limited by the screen space Kibana allows. Likely something I’ll fix in a new release of RedELK.
Overview of all compromised systems
A final thing I want to discuss on the viewpoint of red team operations is the overview of every C2 beacon in the campaign. RedELK presents this with the CS Beacons overview. This is a great overview of every implant, the system it ran on, the time of start and many other details. Again you can use the Kibana export-to-CSV function to generate a list that you can share with blue and/or white.
In this example I want to highlight one thing. RedELK also keeps track if a Cobalt Strike beacon was linked to another beacon. In the example below you can see that beacon ID 455228 was linked to 22170412, which in turn was linked to 1282172642. Opening the full beacon log file and searching for “link to” we circle back to the PsExec example we discussed above.
Redirector Traffic
The examples above all covered overview of red team operations. But RedELK also helps you with giving overview and insight into the traffic that has hit your red team infrastructure. This is done by using the pre-made view Redirector Traffic.
We can see that RedELK parses a lot of information. The default view shows several columns with relevant data, ordered per log line with the latest event on top. Diving into a single log line you can see there are many more information elements. The most important are:
- The
attackscenario, shorthaul in our example. - The
beat.hostnameof the redir this happened on. - The full log line as appeared on the system (
message). - The IP address of the redirector traffic was received on (
redir.frontendip). - The
redirprogramname (Apache in this case) and theredir.frontnameandredir.backendnamewhere on the traffic was received and sent. - Several headers of the HTTP traffic, including X-Host and X-Forwarded-For.
- The
redirtraffic.sourceipof the traffic. - In case X-Forwarder-For was set,
redirtraffic.sourceipbecomes the real client’s address andredirtraffic.sourceipcndcontains the address of the CDN endpoint.
The majority of this information is not available in a default Apache or HAProxy log line. But it is information that the red team is interested in, now or in the future. This is why it is so important to modify the logging configuration of your redirector. Default log setup means limited info.
RedELK also enriches the data with information from several sources. The GeoIP was already shown in the previous example – it adds geo location info and ownership of the IP block and stores it in geoip.* fields.
RedELK als does reverse DNS lookups for the remote IP addresses and it sets a tag if the source IP address was found in a local config file like /etc/redelk/iplist_redteam.conf, /etc/redelk/torexitnodes.conf, etc.
But there is one more enrichment going on that is extremely helpful: Greynoise. Greynoise is a service that aims to identify the internet background noise from scanners, either legit ones such as Shodan and Google, and evil ones such as botnets. Most red teams are not necessarily interested in all the details that Greynoise has about an IP address. But they do want to know when an IP address is scanning their infra that is *not known* as a scanner!
Let’s see the example below. We start with almost 9000 log lines on traffic. When opening one event we can see the multitude of info that Greynoise has on this IP. In our example its likely a MIRAI botnet scanner and the greynoise.status is ok. But when we filter on greynoise.status:"unknown" and NOT redirtraffic.httpstatus:"200" we get all data from IP addresses not belonging to publicly known scanners that scan our infra. We went from almost 9000 hits to 44 hits, a number that is easily analysed by the human eye. Would any of these hits be the blue team scanning our infra?
There are many more examples on interesting searches for traffic hitting your red team infrastructure, e.g. TOR addresses (RedELK tags those), strange user agents such as curl* and python*, etc. But I’m sure you don’t need a blog post to explore these.
Wrap-up
I hope this blog post has given you a better understanding what RedELK has to offer, and how to use it. There is more. I haven’t even touched on visualizations and on dashboards that come with RedELK, and most importantly: alarms. This is left for another blog post.
A few closing thoughts to help you have a smooth experience in getting up-and-running with RedELK:
- Fully follow the installation including modifying of the redirector logging configuration to get the most out of your data.
- Also perform post installation tuning by modifying the config files in
/etc/redelk/on the RedELK server. - RedELK’s main interface is Kibana. It is easy to get started, has a lot of features but it can be tricky to fully understand the powerful search language. Luckily, most searches can also be done via clicky-clicky. I have absolutely no shame in admitting that even after many years of experience with searching in Kibana I still regularly prefer clicks for more difficult searches.
- The pre-made views are just that: pre-made. You can delete, modify and rename them to your liking, or create new ones from scratch.
Have fun exploring RedELK and let me know your thoughts!